
 Deutsch
Day 23: Alarm System
The day before last reveals a tilt sensor behind the door of the Advent calendar. The sensor detects, if it is tilted. We will use it today as a sensor for an alarm system. The speaker from two days ago serves us as the signal generator. We will need the following setup.
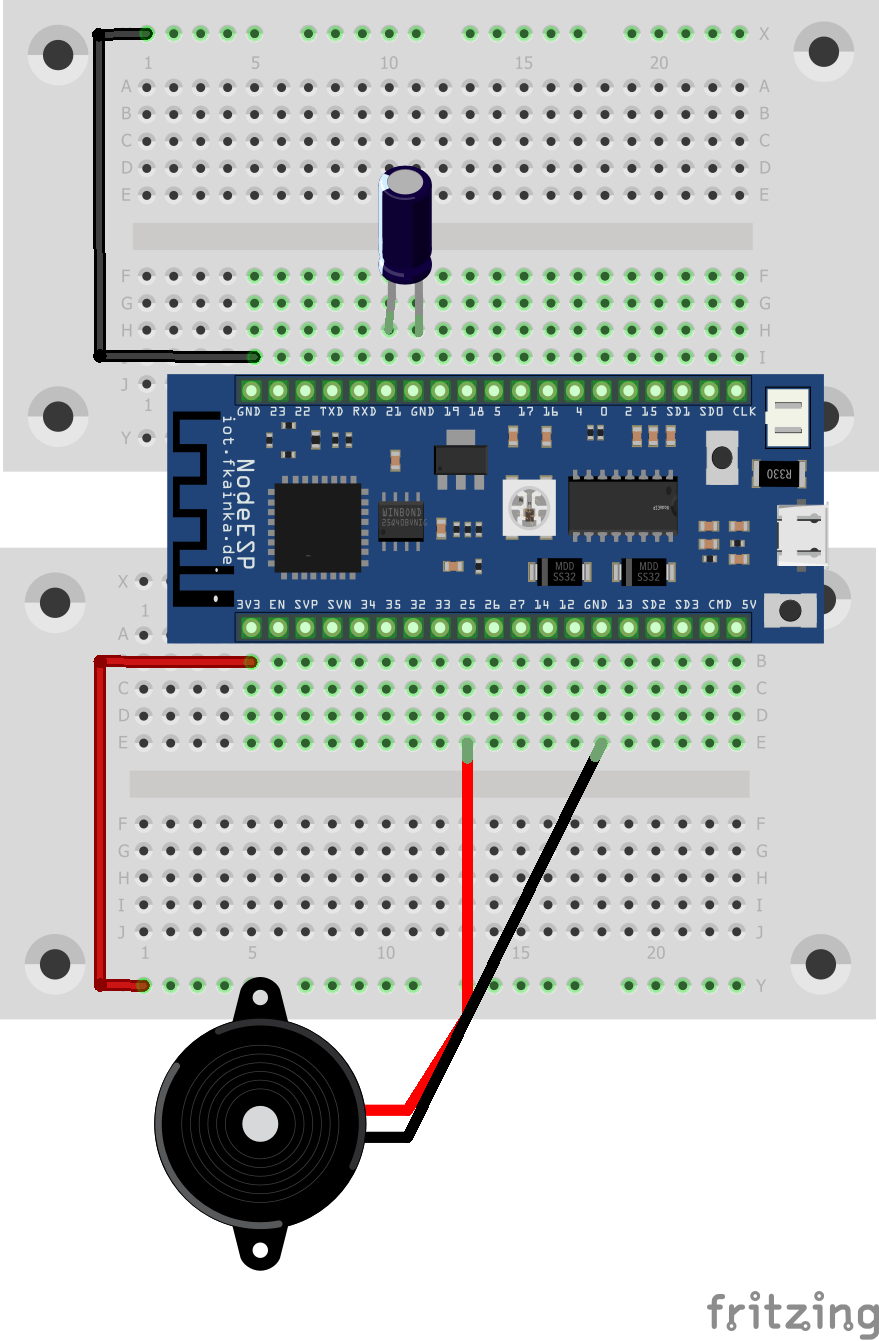
Alarm Setup
As usual, activate the program of today and install the Node-RED flow into the environment. Also adjust the MQTT topic and disable all previous flows.
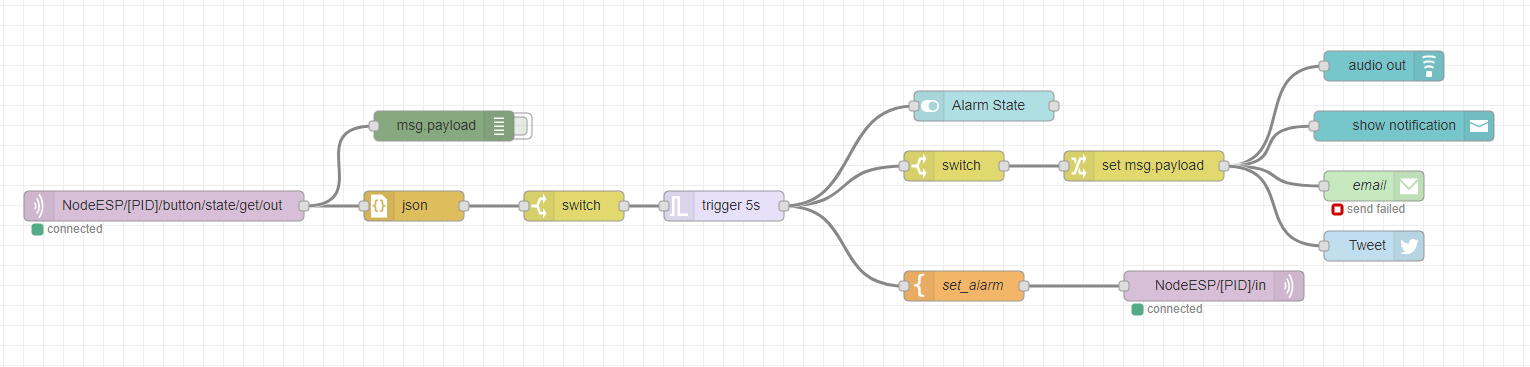
The alarm system flow
The flow now waits for the tilt sensor to be triggered and for a message published under the appropriate topic. This will trigger a trigger node, which will set the payload to TRUE. This is sent back to the board via a topic, which then triggers the alarm. After five seconds the trigger node will send a FALSE that will disable the alarm.
In sync with the alarm signal via the board, a number of other nodes located at the top on the right will indicate the alarm. We have got here today the audio-out node to alert us. Then there is a text message popping up on the user interface. Beyond the user interface, you can use email or Twitter to receive information about an alarm. Another option is to install other nodes that will send push messages to your smartphone. Pushbullet is one of these services with a handy app, for example. Your smart home is thus protected against burglary and theft.
Geht doch, Super !!!
Warum sind es bei die Rechteckkurven? bei mir sind es immer Dreiecke/Säckezahn?
weiß Tilt Sensor/Testbutton
blau Inject Node
Hallo,
etwas vielleicht zur Klärung, meine Gedanken.
Dir Histary läuft nicht ständig, also auch wenn nichts passiert.
Die wird nur angestossen vom Ereignis/Tilt/Test/Injet, darum Sägezahn.
Wie bringe ich die dazu ständig weiter zulaufen?
Eventuell ist hier dein History Node eine Hilfe.
Du musst auf Interpolate “Step” umstellen.
Dann sieht es so aus.
Hab auch schon all 3 Möglichkeiten probiert.
Hallo,
Warum zeigt er die 1/true bei dir an? bis der Ausschaltimpuls kommt?
Der Ein-/Alarmimpuls ist doch nur kurz und wird entspechend ausgewertet.
Bei dir ist aber für die Dauer des Triggerzeitraums (5 Sekunden) dauerhaft eine 1/true zusehen, dann erfolgt der Ausschaltimpuls.
ok., jetzt hab ichs.
Die Ansicht von dir -> wenn du den Switch Node dazwischen machst und diesen wie du beschrieben hast, am Triggerausgang verknüpfst.
Meine Grafik, wenn du ohne Switch Node an den Alarm State Ausgang gehst, hat zwar auch true/false zu bieten, verhält sich aber anderst.
Danke für deine Hilfe.
Danke das war der Hinweis.
Denn ich habe versucht immer am Alarm State – change.msgpayload (true, false zu 0 und 1) – Chart.
Brachte aber nichts.
Viele Veruche, aber immer am Alarm State.
Auch bei mir funktioniert es.
Auch habe ich mal E-Mail probiert, die zwei Meldungen kommen zum einen vom Injet Node, der zweite vom Tilt Sensor.
An Twitter bin ich noch dran.
Diesmal zur Entspannung ein recht einfacher Aufbau und Flow :-) Funktioniert wie erwartet (Dashboard mit audio out und notification funktioniert, Twitter und E-Mail habe ich nicht konfiguriert). Der Ton ist diesmal auch ohne Verstärker laut. Das Dashboard habe ich um eine Testfunktion und eine Auslösehistorie erweitert.
Es gibt anscheinend eine neue Firmware (Button “Check for Firmware Updates” im Webinterface). @fk: Was wurde geändert? Gibt es ein Changelog? Muss der NodeESP danach komplett neu eingerichtet werden oder werden nur die Programme ersetzt und die Config bleibt erhalten?
sorry Bernd den Update Button gab es schon immer.
Es gab eine Firmware im Auslieferungszustand, ein Update danach, dann ein fehlerhaftes Update, was fk. sofort bereinigt hatte und das jetzige.
https://iot.fkainka.de/firmware-neuigkeiten-und-bug-report
https://iot.fkainka.de/nodeesp
Vielleicht kannst du mir helfen.
1. Wie kann man das Aussehen, die Reihenfolge der einzelnen Nopes der UI ändern?
oben Alarm State
darunter Alarm History
darunter Reset
darunter Test
2. wie bekomme ich die Chart Grafik hin, wo muß ich mich andocken, mit dem Chart nope?
Was muß ich einstellen?
Hab schon viel probiert und debugt, doch noch nichts hat zum Erfolg geführt.
Danke
Frage 1:
Die Reihenfolge der Elemente kann man in Node-RED im Dashboard-Register einstellen, siehe Screenshot.
Frage 2:
Habe ich nicht ganz verstanden. Die Chart-Grafik der richtigen Dashboard-Gruppe zuzuordnen, hast Du ja schon geschafft. Oder meintest Du die Einstellungen? Dann siehe Screenshots.
Switch-Node
Change-Node
Change-Node 2
ok. Reihenfole/Anordung hab ich gefunden (YT), Dashboard/Layout.
Nun noch Punkt 2 meiner Anfrage, bitte.
Bitte mal Reload im Browser drücken, Antwort ist schon da…
Super, danke.
Es gibt für die Firmware eine eigene Seite: https://iot.fkainka.de/firmware-neuigkeiten-und-bug-report
Sorry, hatte ich bisher nicht gesehen.